Run Lyα transfer through a simulated galaxy
Apply Lyα radiative transfer to a TNG50 galaxy simulation. Follow photons from a central source through its gas, then inspect the escaping light in a map and spectra.
Before you start
Use the THOR and plotting setup and the galaxy cutout from Prepare. Put the downloads below in the same working directory as the cutout. For an introduction to Lyα transport, see the static-sphere tutorial.
Configure
Download lya-tng.yaml into your working directory.
This run emits 10,000 photons isotropically from a point near the galaxy center, at line center in the local gas frame. It uses the snapshot's neutral-hydrogen density, temperature and velocity fields, with dust and Hubble flow omitted.
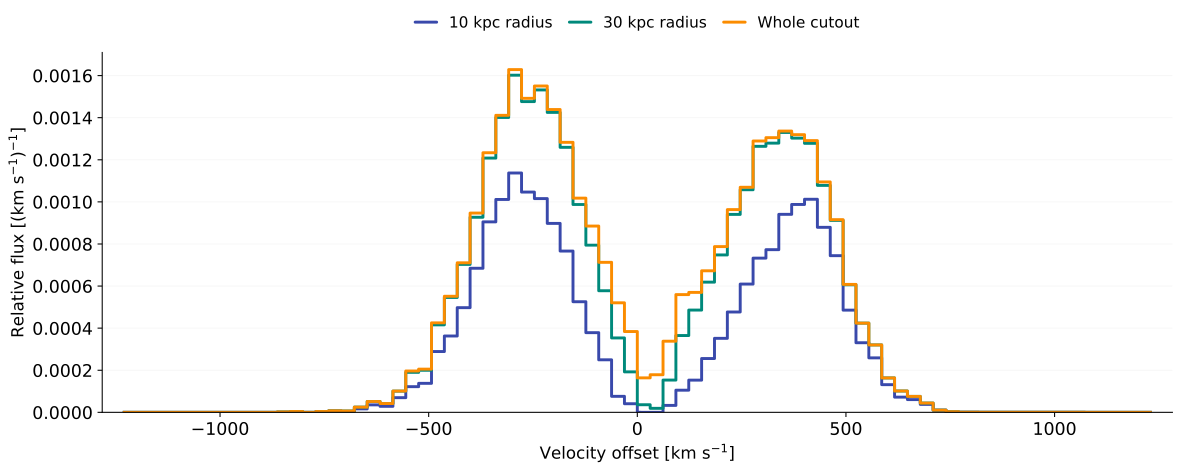
The map looks along +z. The spectra compare the flux within 10 and 30 physical kpc of the source with the whole cutout. Circles on the map mark the smaller apertures.
lya-tng.yaml
# Lyα photons from a central source through the TNG50 gas cutout. [AI-Codex]
dataset_type: pointcloud_voronoi
driver_type: mcrtsimulation
device: cpu
pointcloud_voronoi:
  hilbert_bits: 8
  loader: gadget
  gadget:
    path: ./tng50-halo625-gas-stars-v2.hdf5
    fields: [PositionX, PositionY, PositionZ, Temperature, Density, HIdensity, VelocityX, VelocityY, VelocityZ]
    zoom_box: [[0.4945, 0.5055], [0.4945, 0.5055], [0.4919, 0.5029]]
mcrtsimulation:
  outputpath: output-tng-lya
  overwrite: true
  linename: Lya
  nphotons_max: 10000
  nphotons_step_max: 10000
  nsteps_per_photon_max: 10000000
  acc_scheme: Smith15
  use_atau0nl: true
  emissionmodel:
    mode: singlesource
    singlesource:
      nphotons: 10000
      lum_total: 1.0e+42
      position: [0.509, 0.489, 0.736]
    spectrum:
      shape: delta
      constant:
        shift: 0.0
  use_peeling: true
  outputprocessors:
  - type: photon
    streams: [input, original]
  - type: sbmap
    center: [0.509, 0.489, 0.736]
    north: [0.0, 1.0, 0.0]
    nbins_x: 96
    nbins_y: 64
    left_x: 0.401
    right_x: 0.599
    left_y: 0.434
    right_y: 0.566
  - type: apertureSpectrum
    center: [0.509, 0.489, 0.736]
    north: [0.0, 1.0, 0.0]
    left: -5.0
    right: 5.0
    nbins: 80
    aperture_radii: [10 pkpc, 30 pkpc, 500 pkpc]
Run
Inspect the result
Download thorplot.py and plot_lya_tng.py into the same directory, then run:
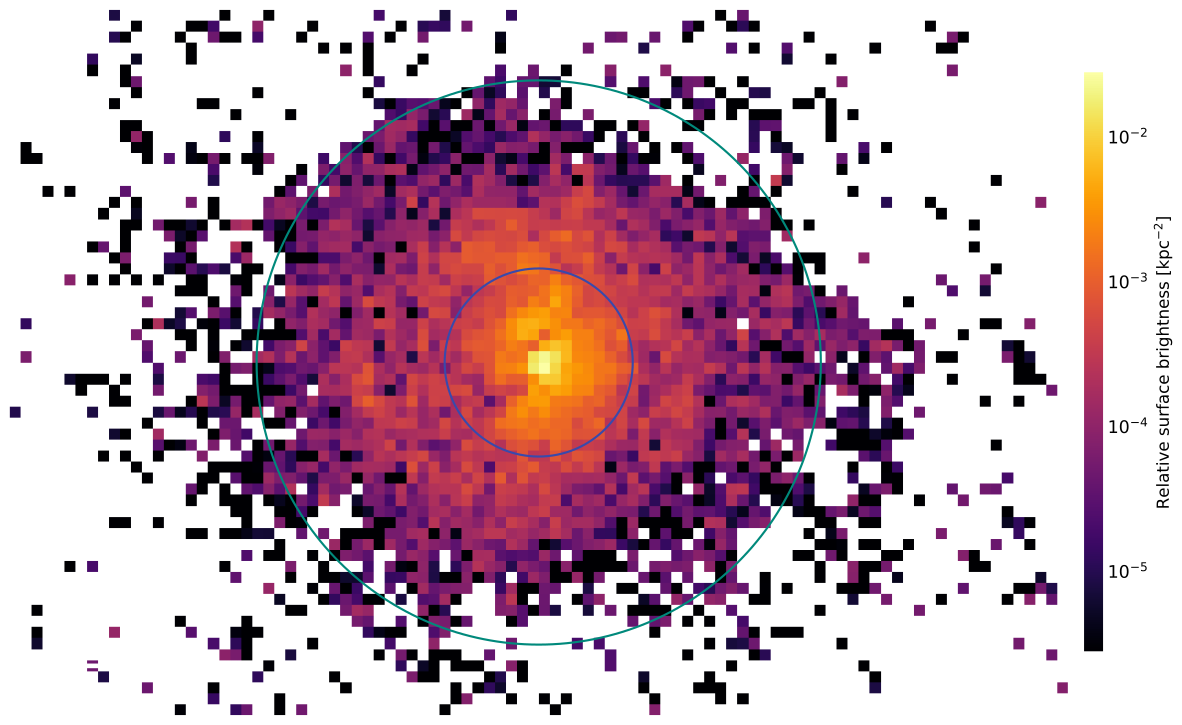
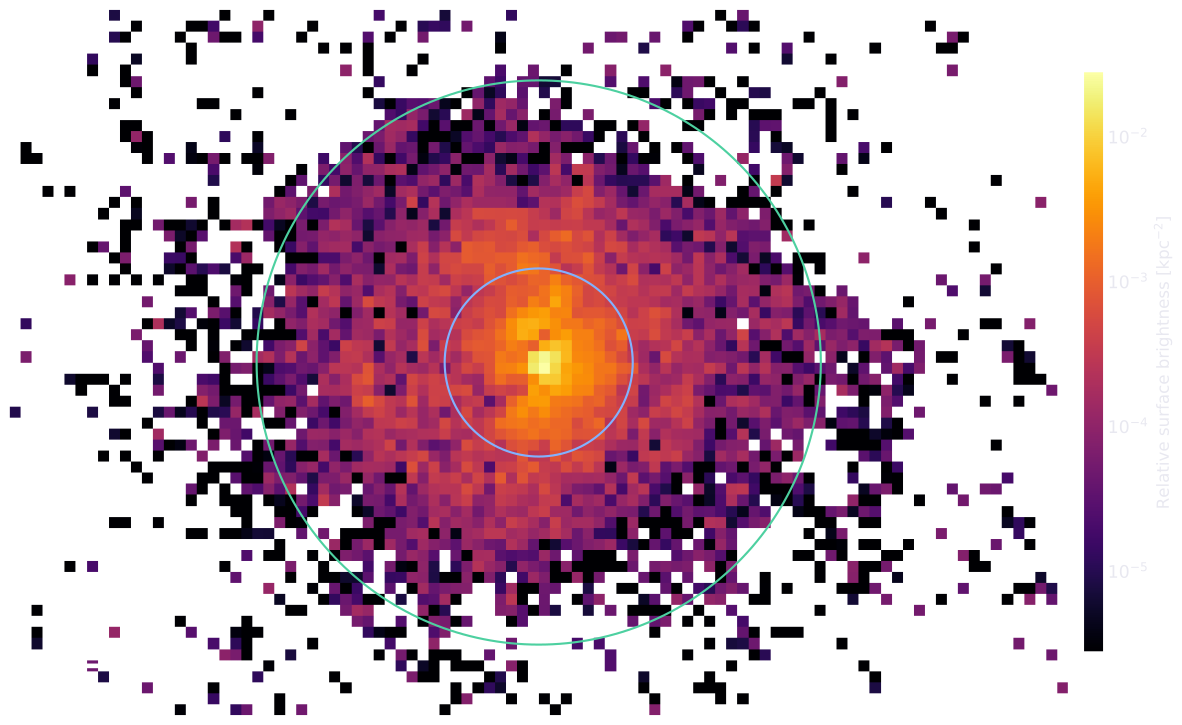
The output image lya-tng-sbmap.png shows relative flux per physical area.
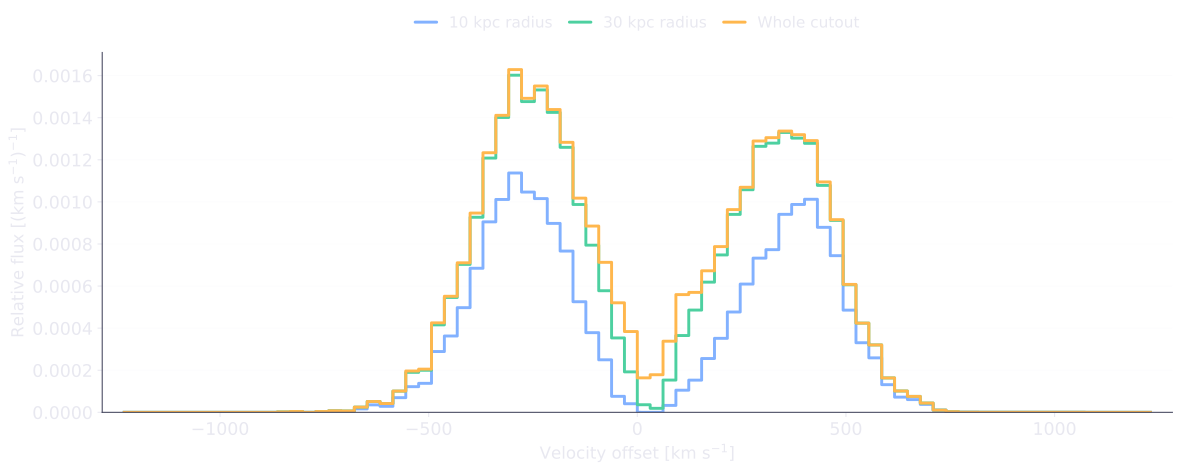
lya-tng.png compares the aperture spectra using a shared normalization,
so smaller apertures retain their lower enclosed flux. Velocity offsets are
relative to rest-frame Lyα, with the galaxy's bulk motion retained.
How the map and spectra are collected
With use_peeling, THOR estimates the light seen along +z. The
output processors sbmap and
apertureSpectrum record the map and spectra, using the same center and
viewing direction. The 500 kpc aperture covers the whole cutout.
The plotting script reads the binned results from output-tng-lya/peel/data.h5.
Variations
Try different aperture_radii, keeping the final 500 kpc aperture as the
whole-cutout reference. Move singlesource.position and both processor
center values together to compare escape from different parts of the galaxy.
Increase singlesource.nphotons for less noise; increase nphotons_max and
nphotons_step_max too if you go above 10,000 photons.