Resonant line transfer
Learn resonant line transfer by following Lyα photons through a static sphere of neutral hydrogen and plotting the escaping spectrum. Then explore galaxy Lyα and cluster X-ray scattering in the Cookbook examples below.
The first run uses shellmodel with zero inner radius, giving a filled sphere
that we can compare with the Dijkstra+06 solution.
1. Configure
From your simulation working directory, download the configuration:
Until this guide is published, use the preview download.
THOR generates the gas distribution and photon source internally. This example needs no snapshot or reference-table downloads.
This is the complete configuration:
my_first_sim.yaml
dataset_type: 'shellmodel'
driver_type: 'mcrtsimulation'
device: "cpu"
log_level: info

shellmodel:
  boxsize: 3.086e21       # cm (1 kpc)
  inner_radius: 0.0
  outer_radius: 0.1
  density: 0.078098       # cm^-3 (tau ~ 1e6)
  temperature: 20000.0
  density_fluff: 0.0
  temperature_fluff: 0.0
  outflow_velocity: 0.0

mcrtsimulation:
  density_check_lenient: true  # Synthetic density is neutral hydrogen.
  outputpath: output
  overwrite: true
  linename: Lya
  nphotons_max: 10000
  nphotons_step_max: 10000
  nsteps_per_photon_max: 10000000
  acc_scheme: Smith15
  emissionmodel:
    mode: "singlesource"
    singlesource:
      nphotons: 1000
      lum_total: 1e42
      position: [0.5, 0.5, 0.5]
The sphere has radius 100 pc and temperature 20,000 K. Its density gives a
center-to-edge line-center optical depth of approximately \(\tau_0=10^6\).
The density_check_lenient setting lets this synthetic dataset's density serve
as neutral-hydrogen number density. The source emits 1,000 photons.
2. Run
Run from the directory containing the configuration:
A successful run ends with Thor finished. and its elapsed time. The first
container run may take longer while kernels compile. Rerunning this configuration
replaces its previous output (overwrite: true).
3. Inspect the result
Download plot_spectrum.py and thorplot.py into your working directory, then run:
The output image spectrum.png compares the escaping photons
with the analytical solution for this static sphere. The plot weights packets
by photon rate and normalizes the profile to unit area. For energy-weighted
spectra and luminosities, see packet weights.
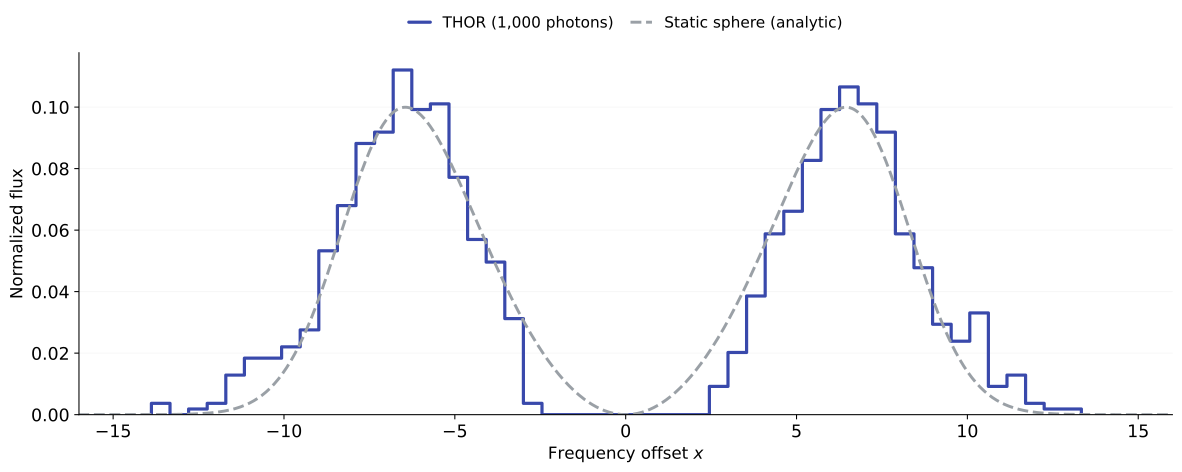
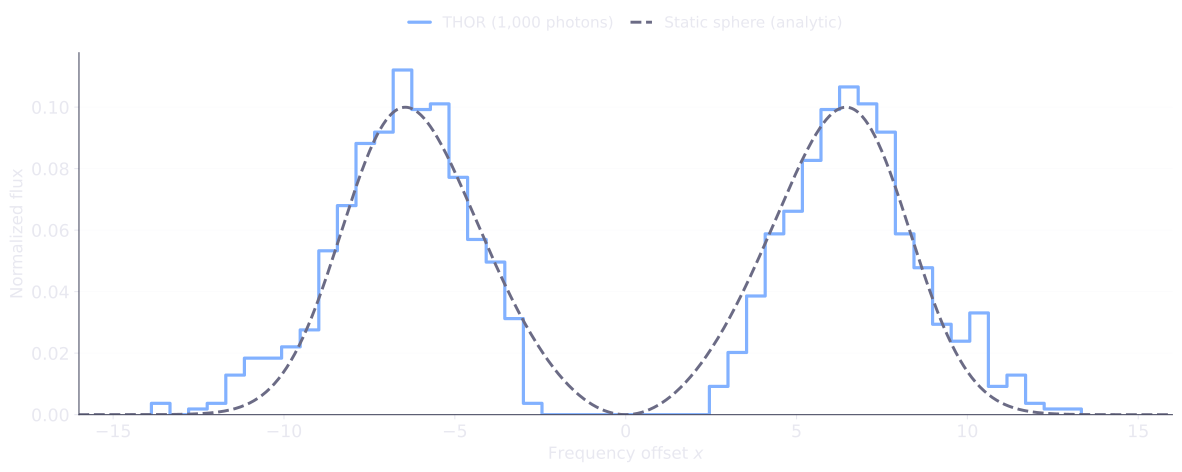
Scattering moves photons away from line center before they escape, producing two peaks. The static sphere gives an approximately symmetric spectrum; with 1,000 photons, individual bins fluctuate around the analytic curve. The horizontal axis is frequency offset in thermal Doppler units; positive values are blueward of line center.
4. Things to try
Increase the optical depthPush the peaks farther apart.
Copy my_first_sim.yaml to denser.yaml and change these values,
keeping the other settings:
shellmodel:
  density: 0.78098       # ten times the original density
mcrtsimulation:
  outputpath: output-denser
Run the new configuration:
Download plot_spectrum_variation.py into the same directory and compare with the original run:
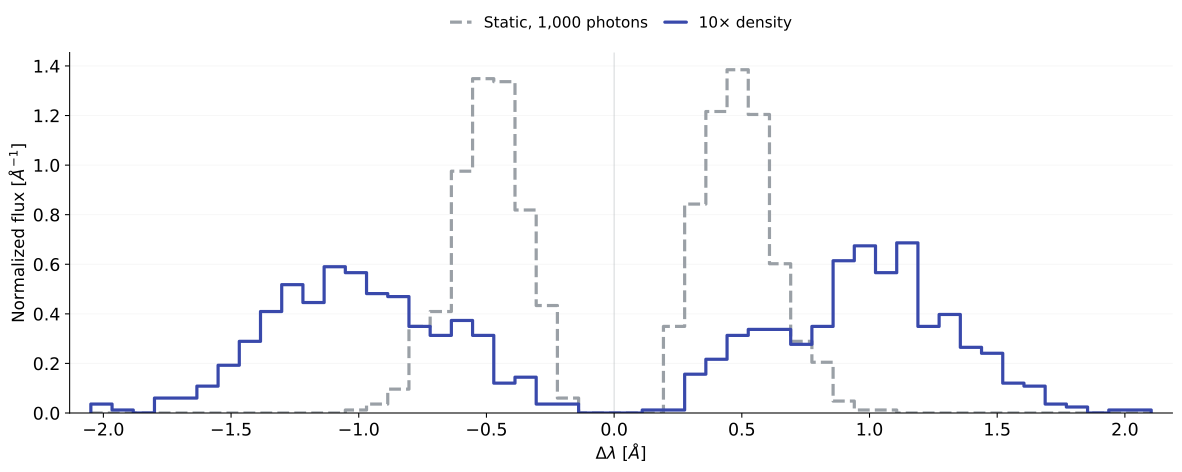
In spectrum-denser.png, both photon-rate profiles use the same bins and
are normalized to unit area.
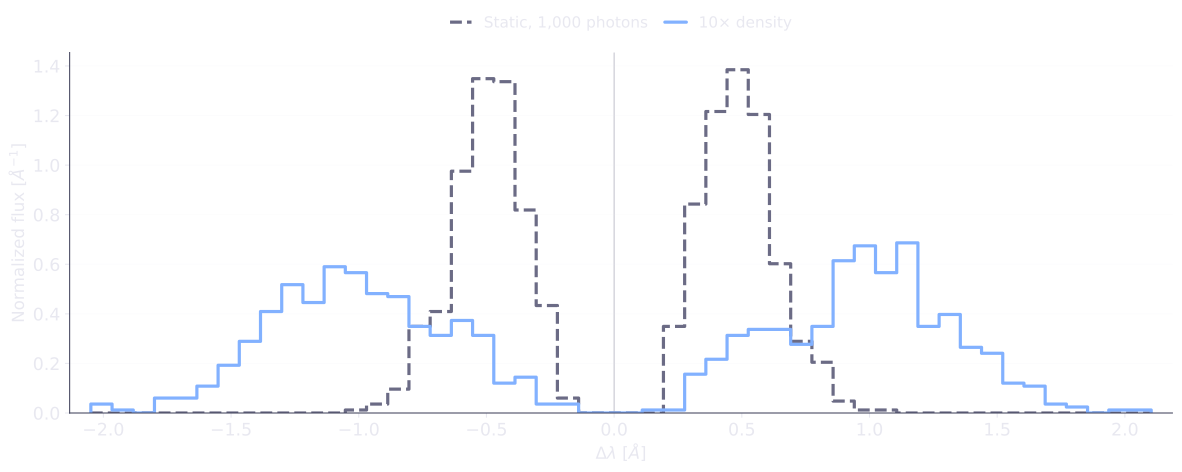
The larger optical depth pushes the peaks farther from line center. In this optically thick limit, offsets scale approximately as \(\tau_0^{1/3}\), so ten times the density increases their separation by about 2.15 times.
With thor-tools, you can also compare with the higher-optical-depth analytic solution:
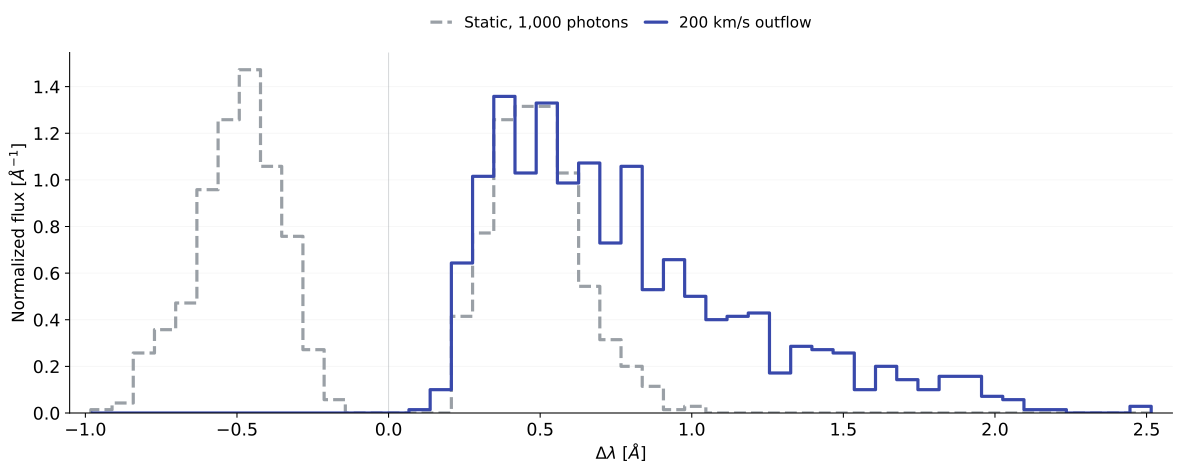
Add an outflowSee how moving gas changes the spectrum.
Copy my_first_sim.yaml to outflow.yaml and change these values:
shellmodel:
  outflow_velocity: 2e7  # cm/s (200 km/s) at the outer radius
mcrtsimulation:
  outputpath: output-outflow
  max_step: 0.00009     # resolve the changing gas velocity
Run the new configuration:
Download plot_spectrum_variation.py into the same directory and compare with the original run:
In spectrum-outflow.png, both photon-rate profiles use the same bins and
are normalized to unit area.
The small max_step resolves the velocity gradient across the sphere.
Expansion makes the spectrum asymmetric, favoring the red side
(Δλ > 0). The static-sphere analytic curve no longer applies.
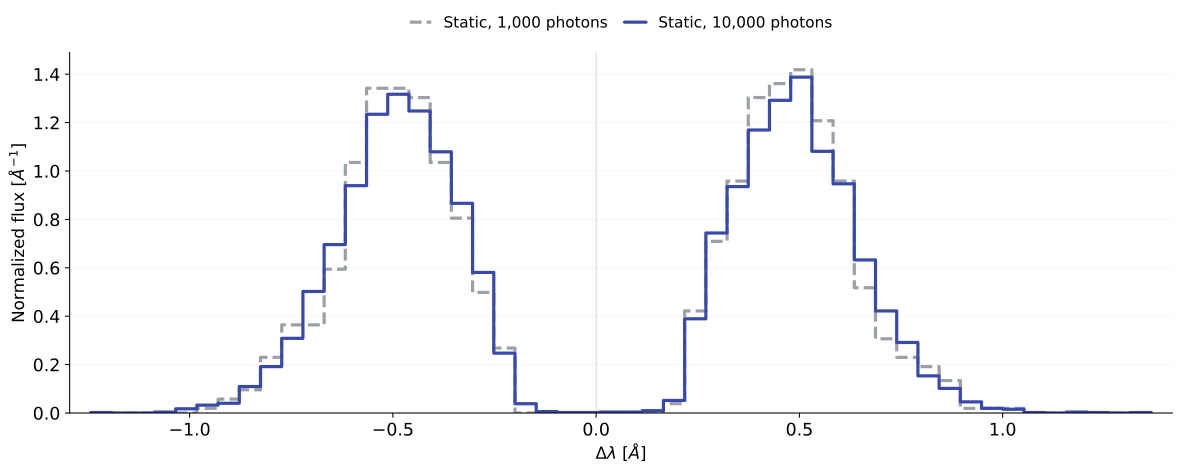
Reduce the noiseMake the spectrum smoother with more photons.
Copy my_first_sim.yaml to smoother.yaml and change these values:
Run the new configuration:
Download plot_spectrum_variation.py into the same directory and compare with the original run:
In spectrum-smoother.png, both photon-rate profiles use the same bins and
are normalized to unit area.
The spectrum keeps the same overall shape, with smaller sampling fluctuations. Ten times as many photons reduce typical Monte Carlo noise by about \(\sqrt{10}\), while increasing the runtime.
Plot with thor-tools
If you have a THOR checkout, you can also use its analysis CLI:
uv tool install --python 3.11 "/path/to/thor/python/thor-rt[mcrt]"
thor-tools mcrt spectrum plot my_first_sim.yaml --compare-analytic sphere --tau0 1e6
The output image plots/spectrum_original_global.png shows the same
analytical comparison. See MCRT analysis for more options.
Continue in the Cookbook
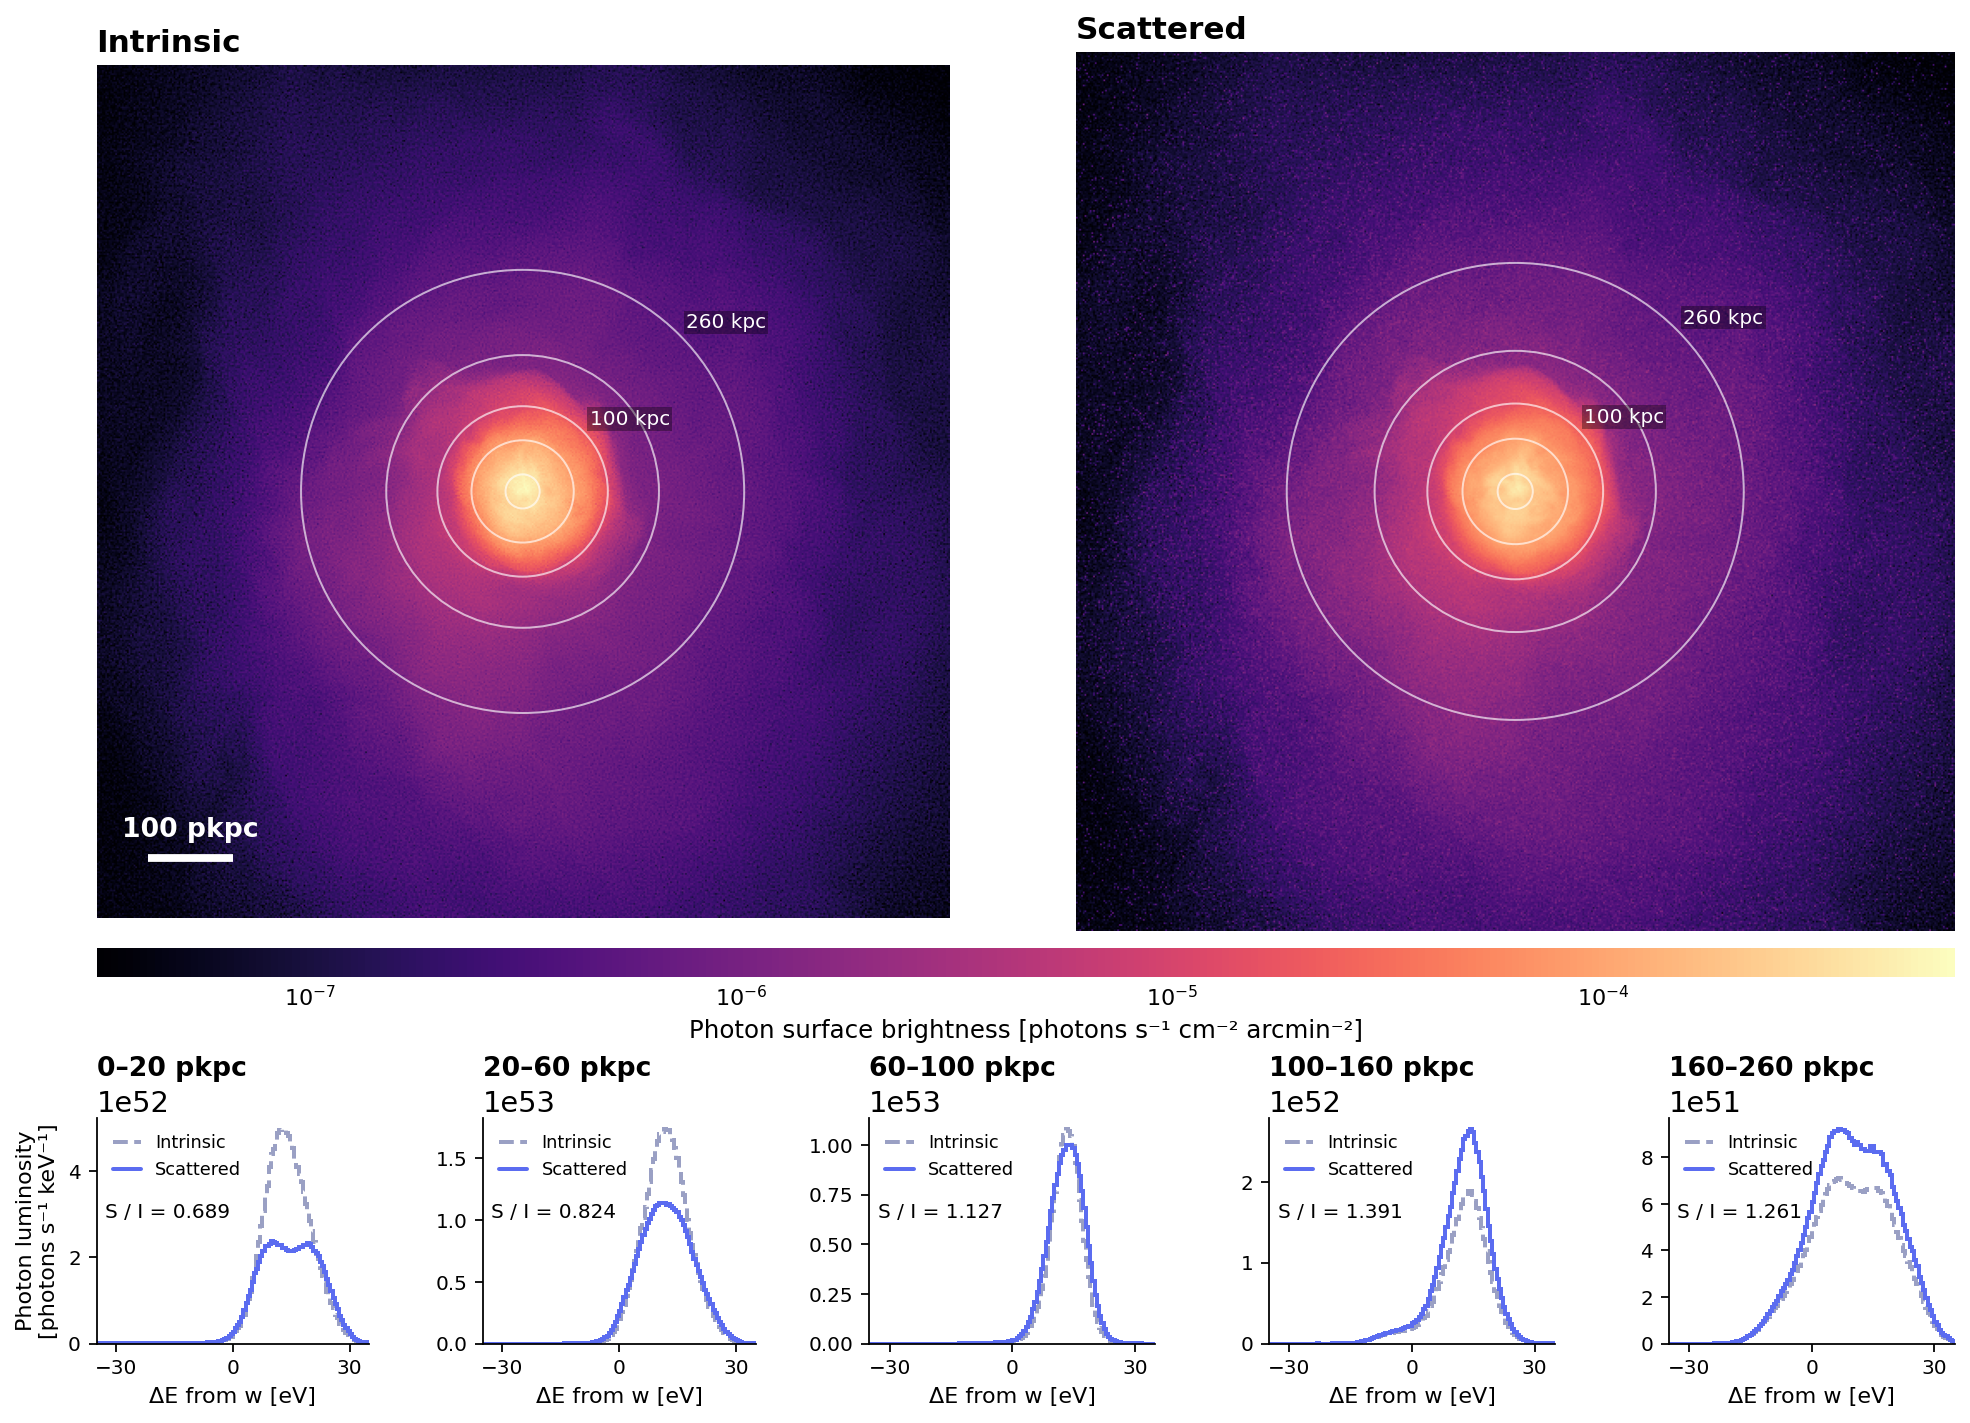
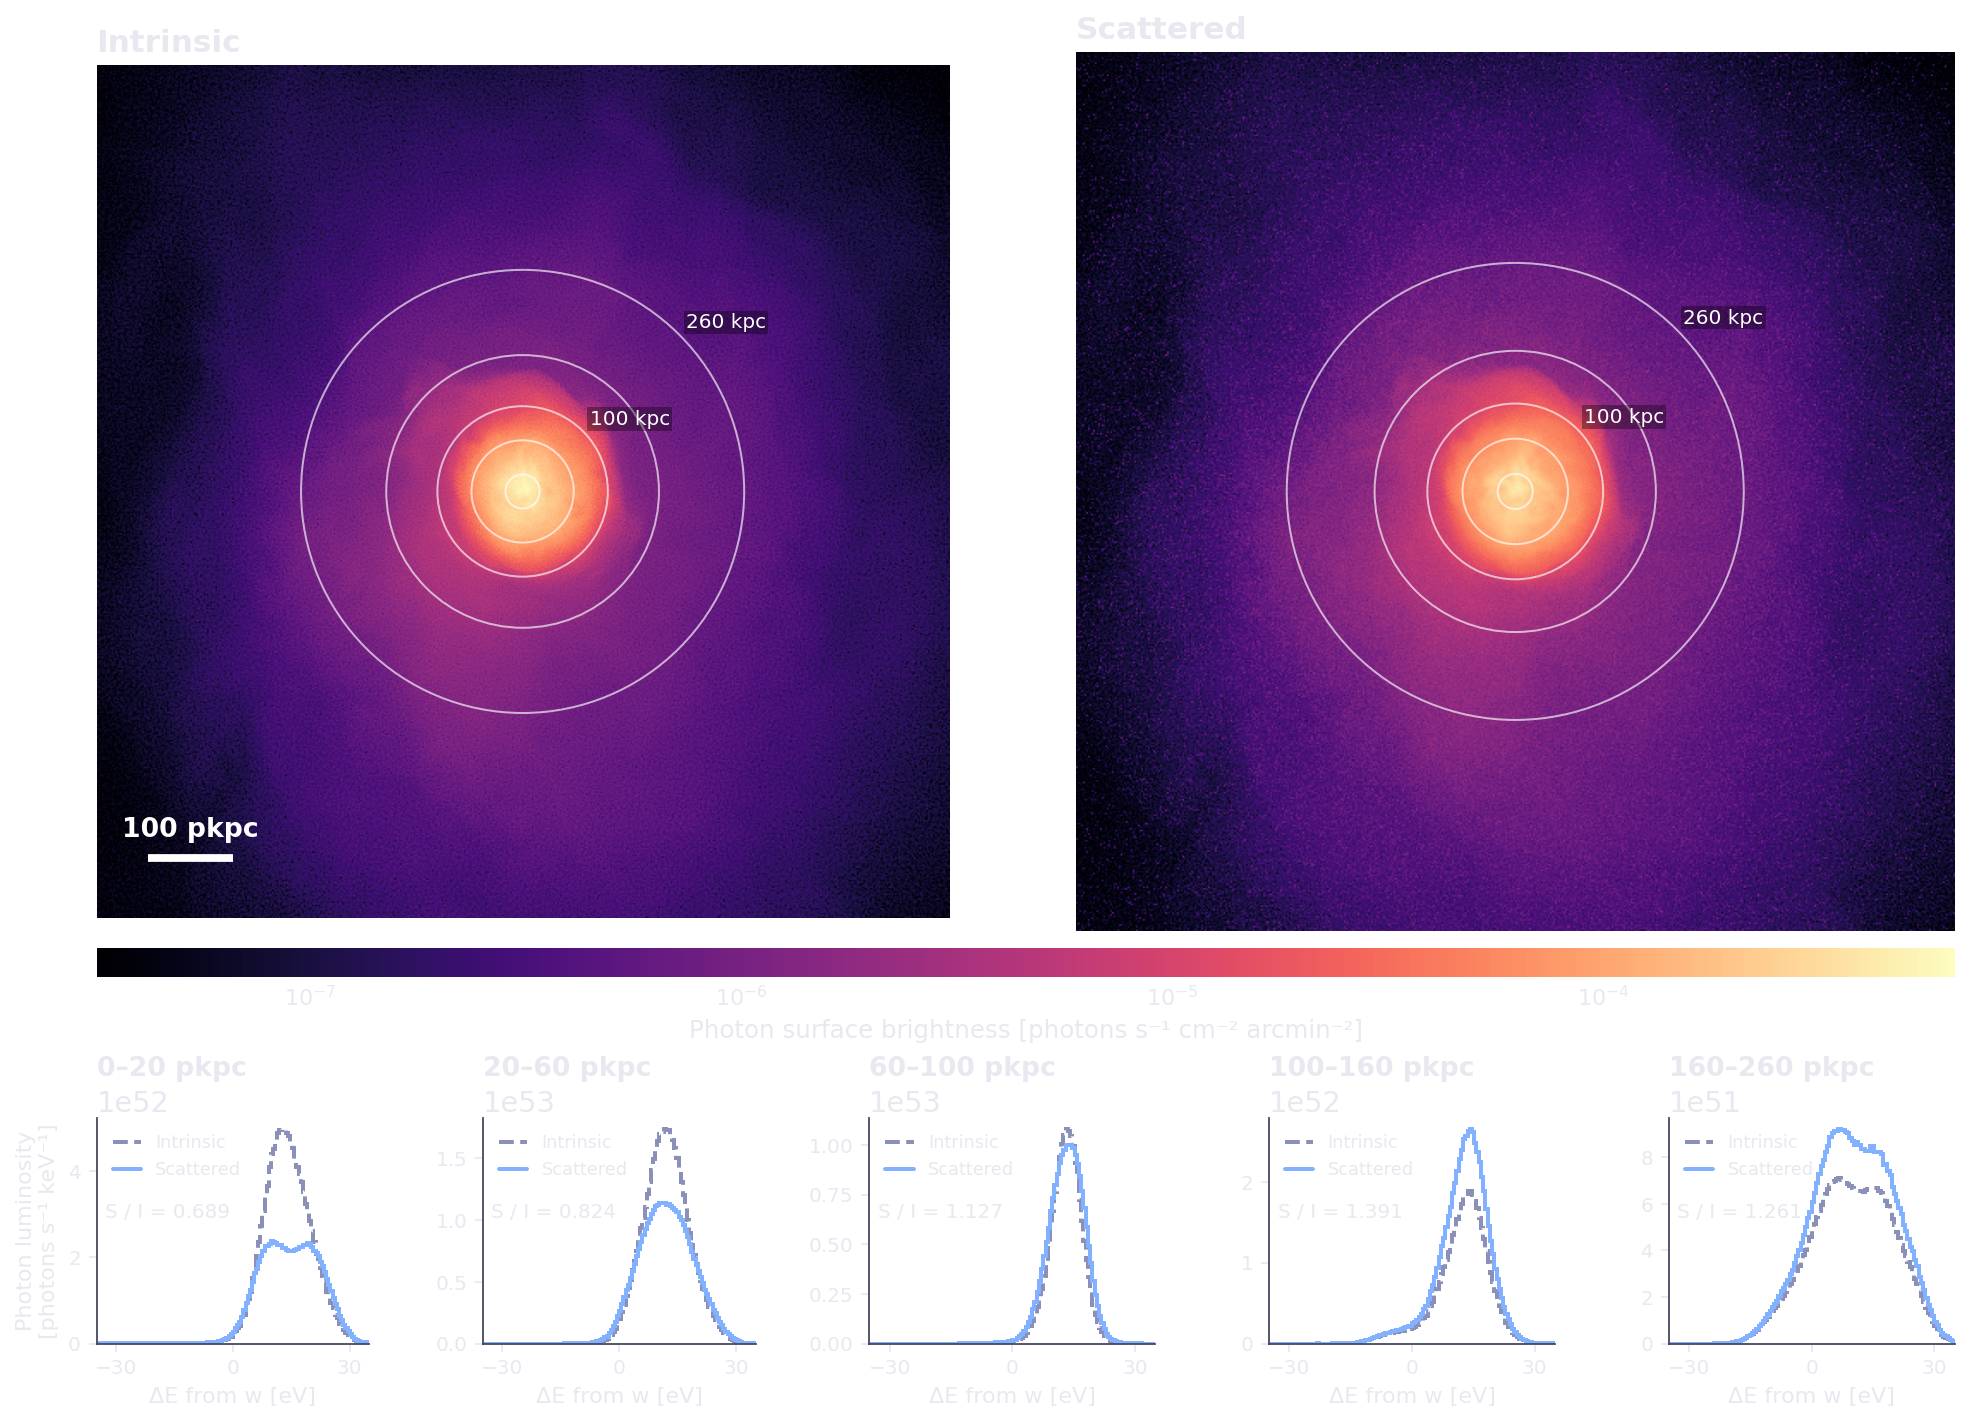
Apply the same workflow to a simulated galaxy or galaxy cluster.