Visualization
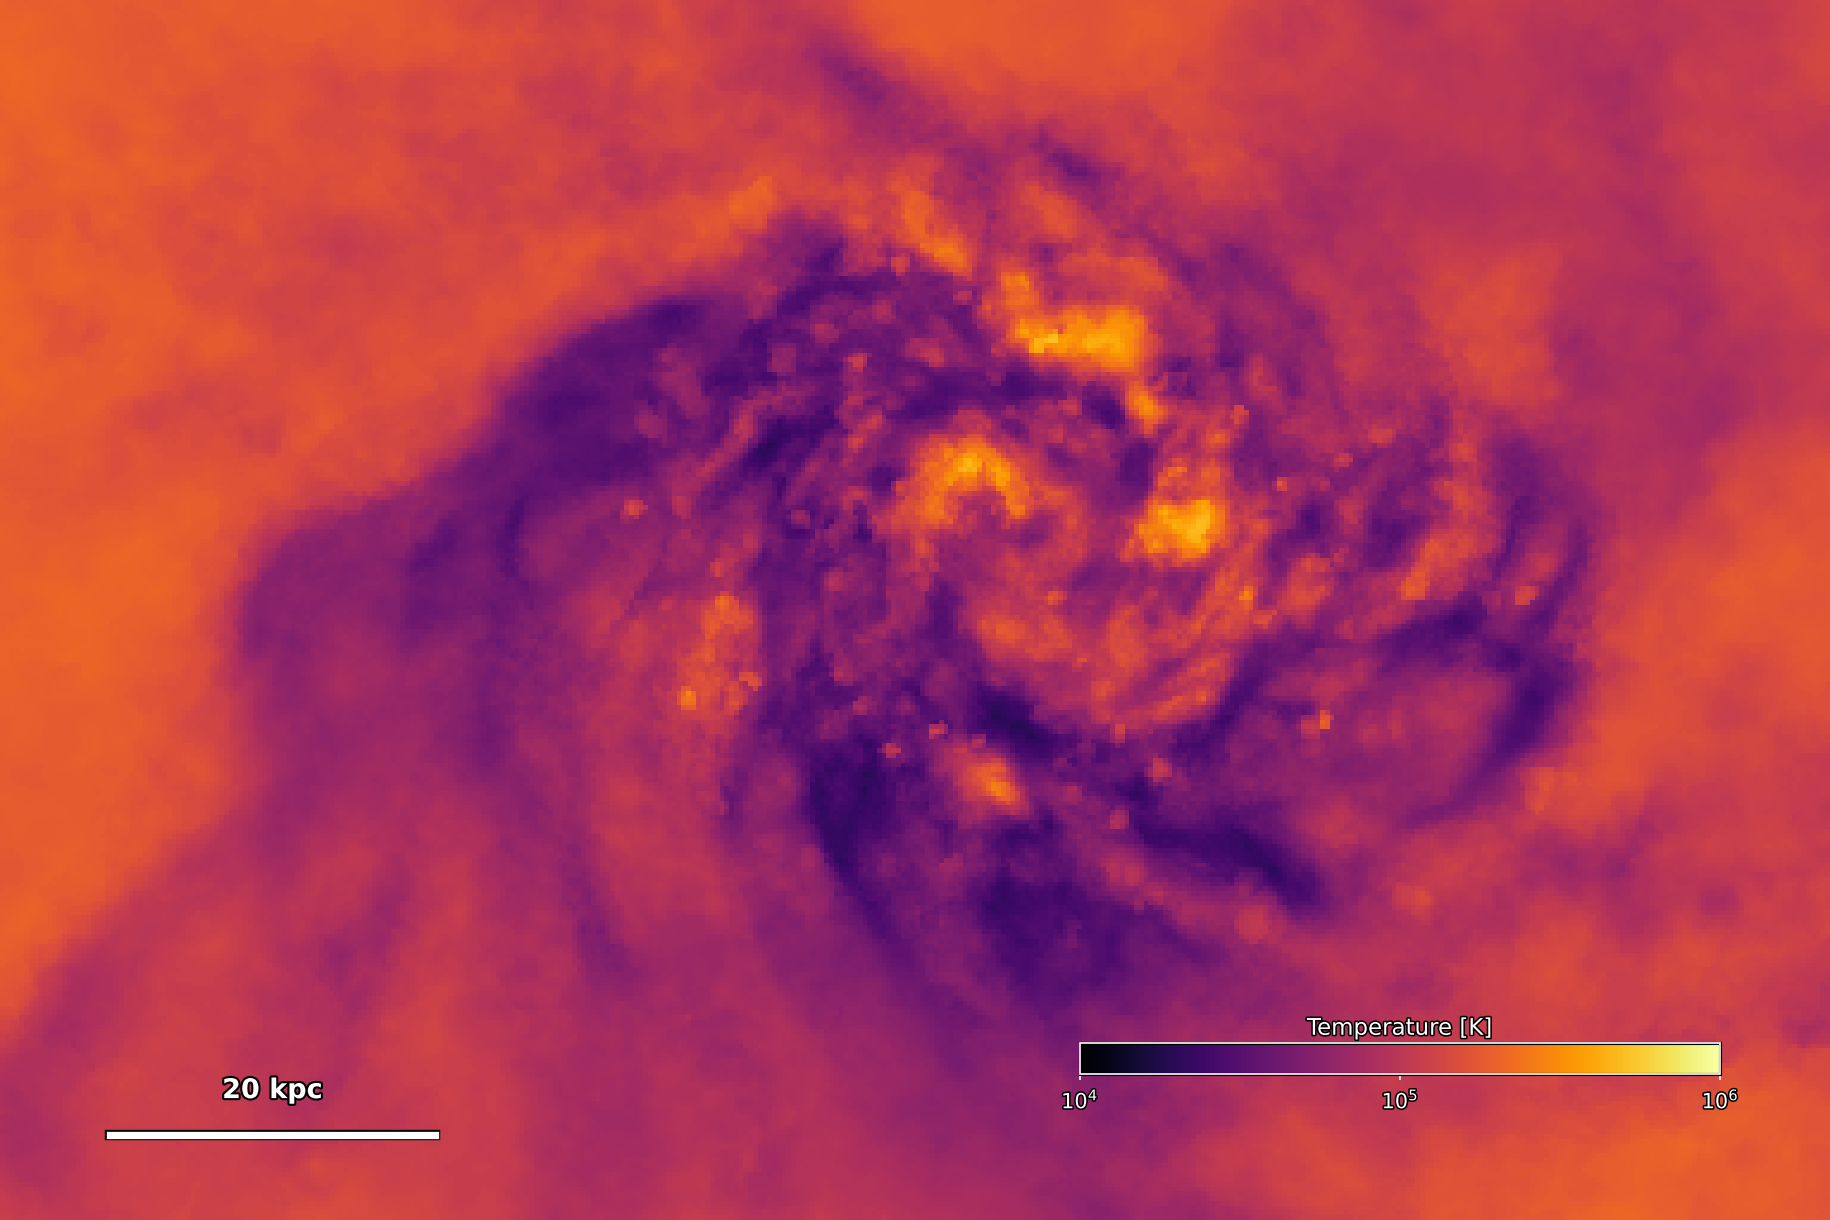
Make a density-weighted temperature map of a TNG50 galaxy cutout at redshift zero. THOR reconstructs a Voronoi mesh from the gas cells and traces parallel rays through it.
1. Configure
Use the galaxy cutout from Prepare. Download projection.yaml into your working directory.
projection.yaml
# Project a TNG50 cutout onto a temperature map. [AI-Codex]
dataset_type: pointcloud_voronoi
driver_type: raytracer
device: cpu

pointcloud_voronoi:
  hilbert_bits: 8
  loader: gadget
  gadget:
    path: ./tng50-halo625-gas-stars-v2.hdf5
    fields: [PositionX, PositionY, PositionZ, Temperature, Density]
    zoom_box: [[0.4945, 0.5055], [0.4945, 0.5055], [0.4919, 0.5029]]

raytracer:
  dist_max: 1.0
  max_step: 0.01
  outputpath: temperature.zr
  overwrite: true
  operators:
    projections:
      fields: [Temperature]
      mode: manual
      view: orthogonal
      widths: [0.264, 0.176]
      npixels: [768, 512]
      position: [0.5, 0.5, 0.01]
      direction: [0.0, 0.0, 1.0]
      up: [0.0, 1.0, 0.0]
      use_weighting: true
      perform_averaging: true
zoom_box encloses the cutout in a cube. Camera positions and widths use
fractions of that domain. The view looks along the z-axis, centered on the
galaxy, and covers about 150 × 100 kpc at 768 × 512 pixels.
use_weighting and perform_averaging together give the density-weighted mean
temperature along each ray: \(\int \rho T\,dl / \int \rho\,dl\).
2. Run
A successful run ends with Thor finished. and writes temperature.zr.
Rerunning replaces that output (overwrite: true).
3. Inspect the result
Download plot_projection.py and thorplot.py into the same directory, then run:
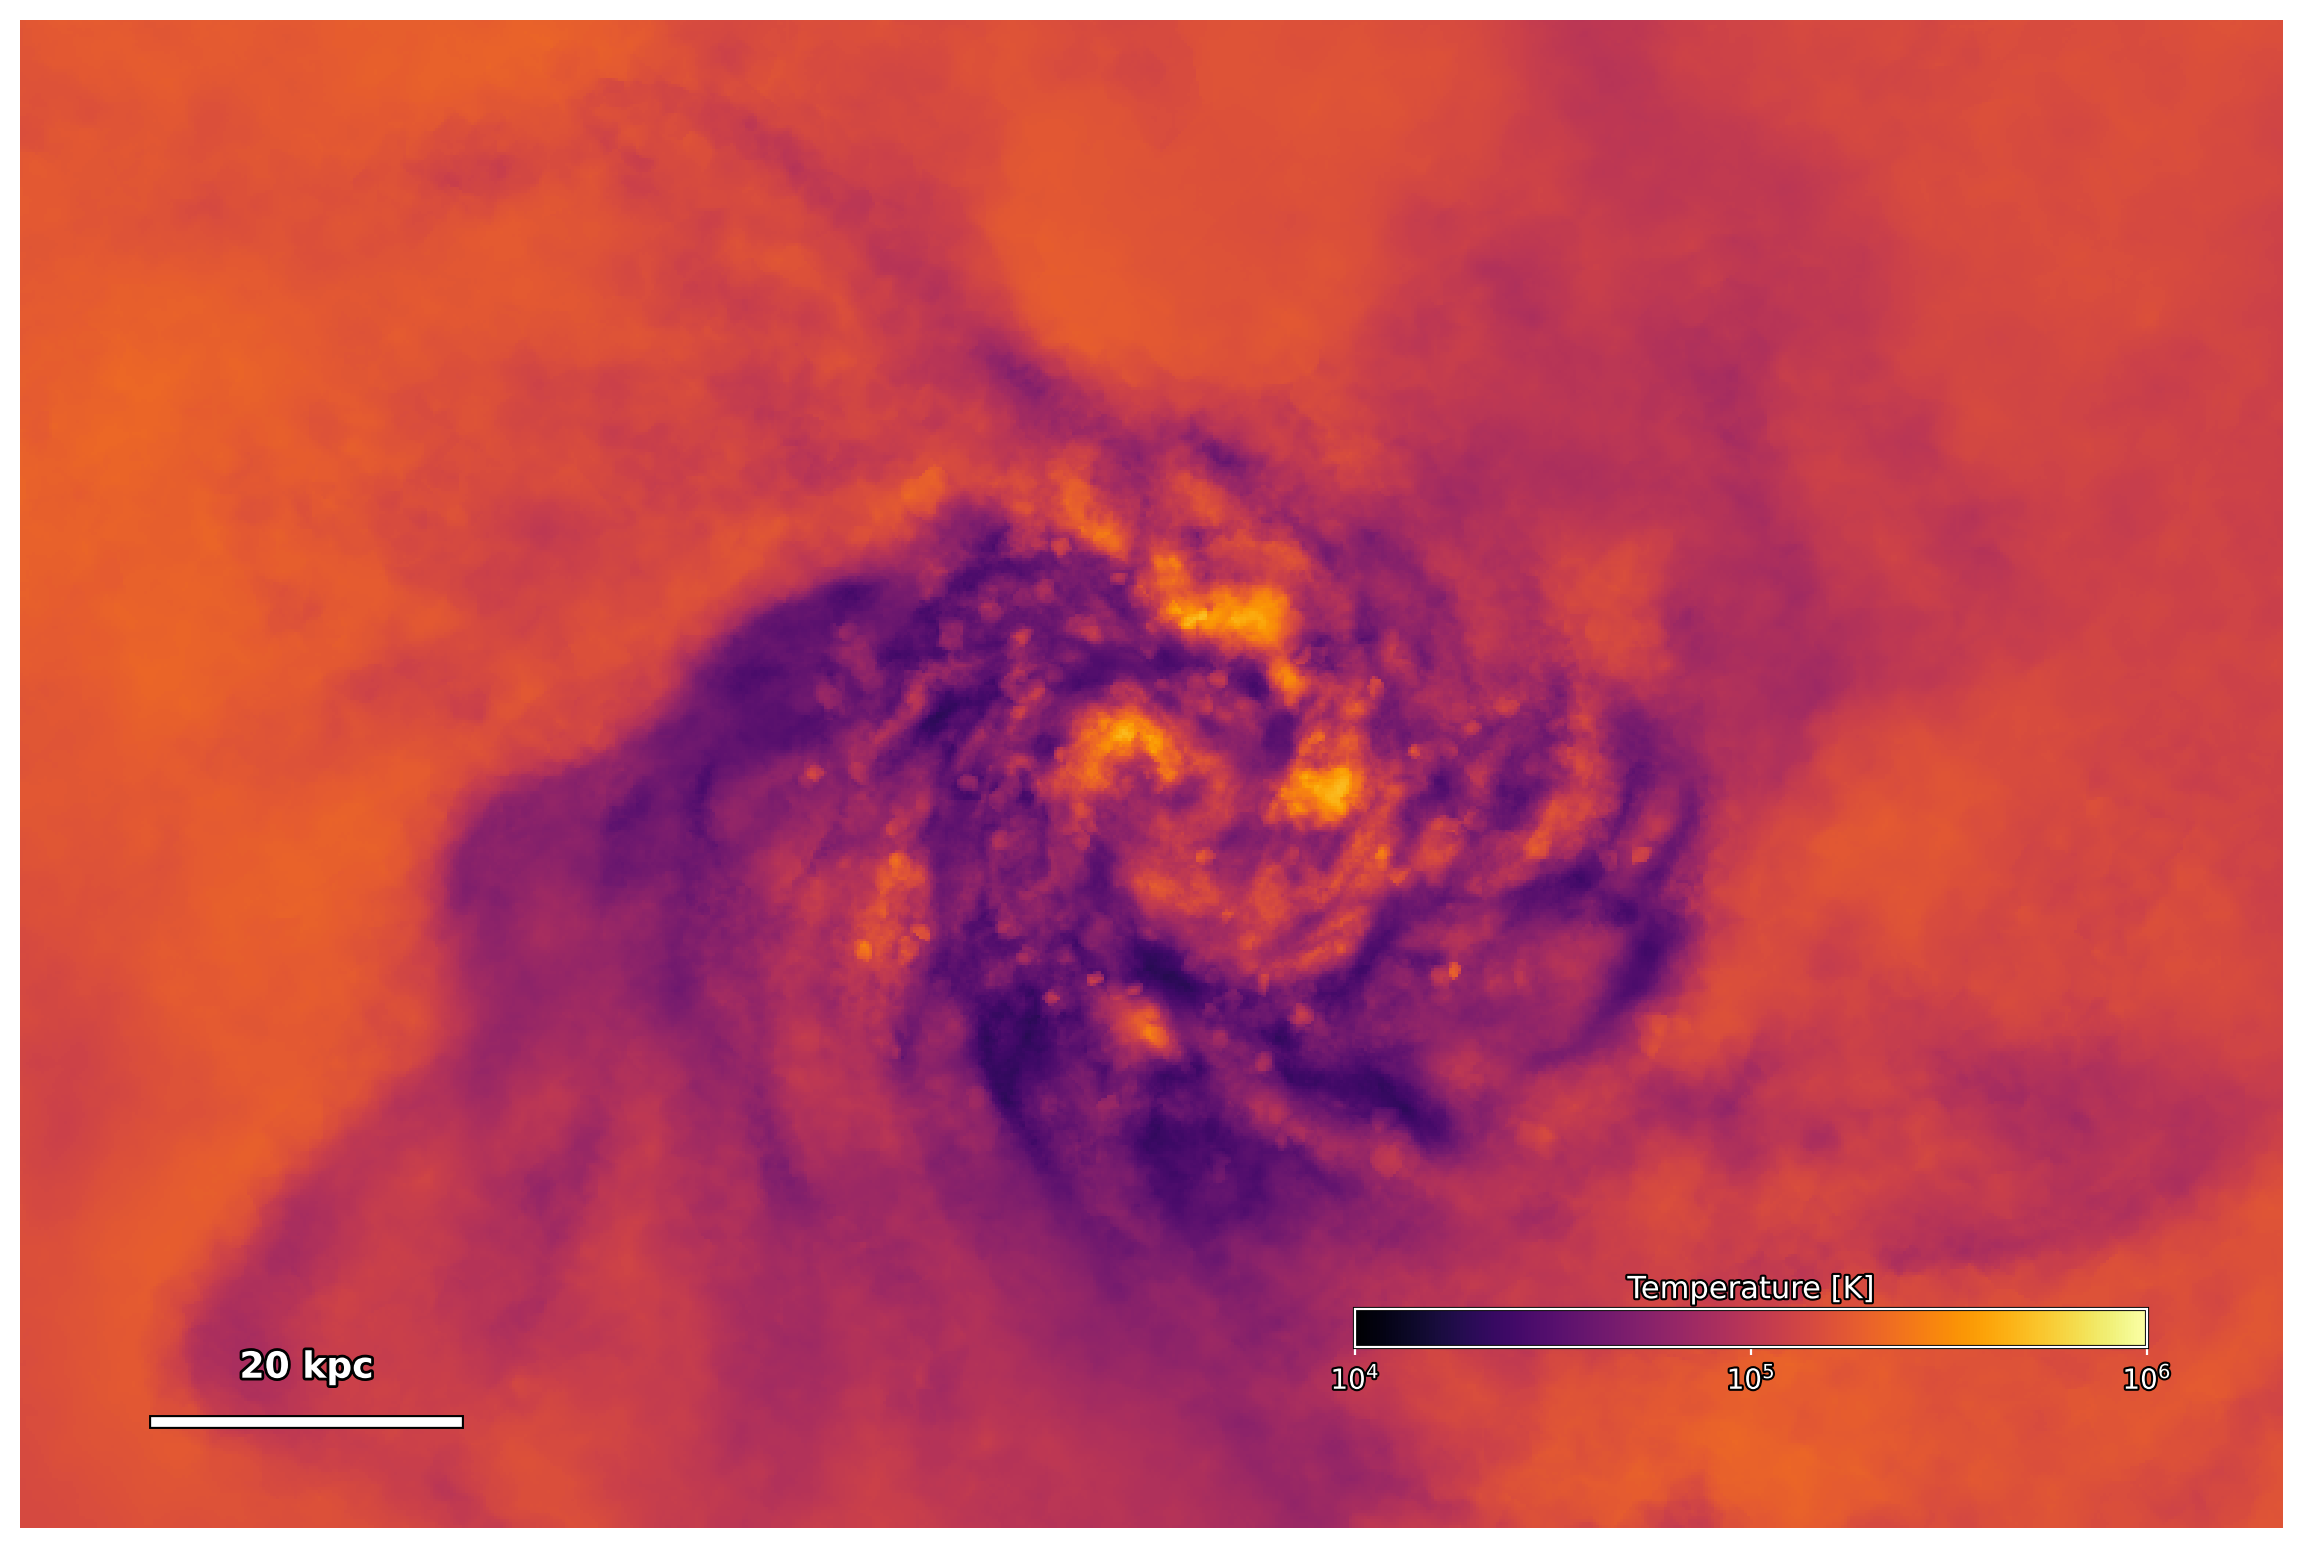
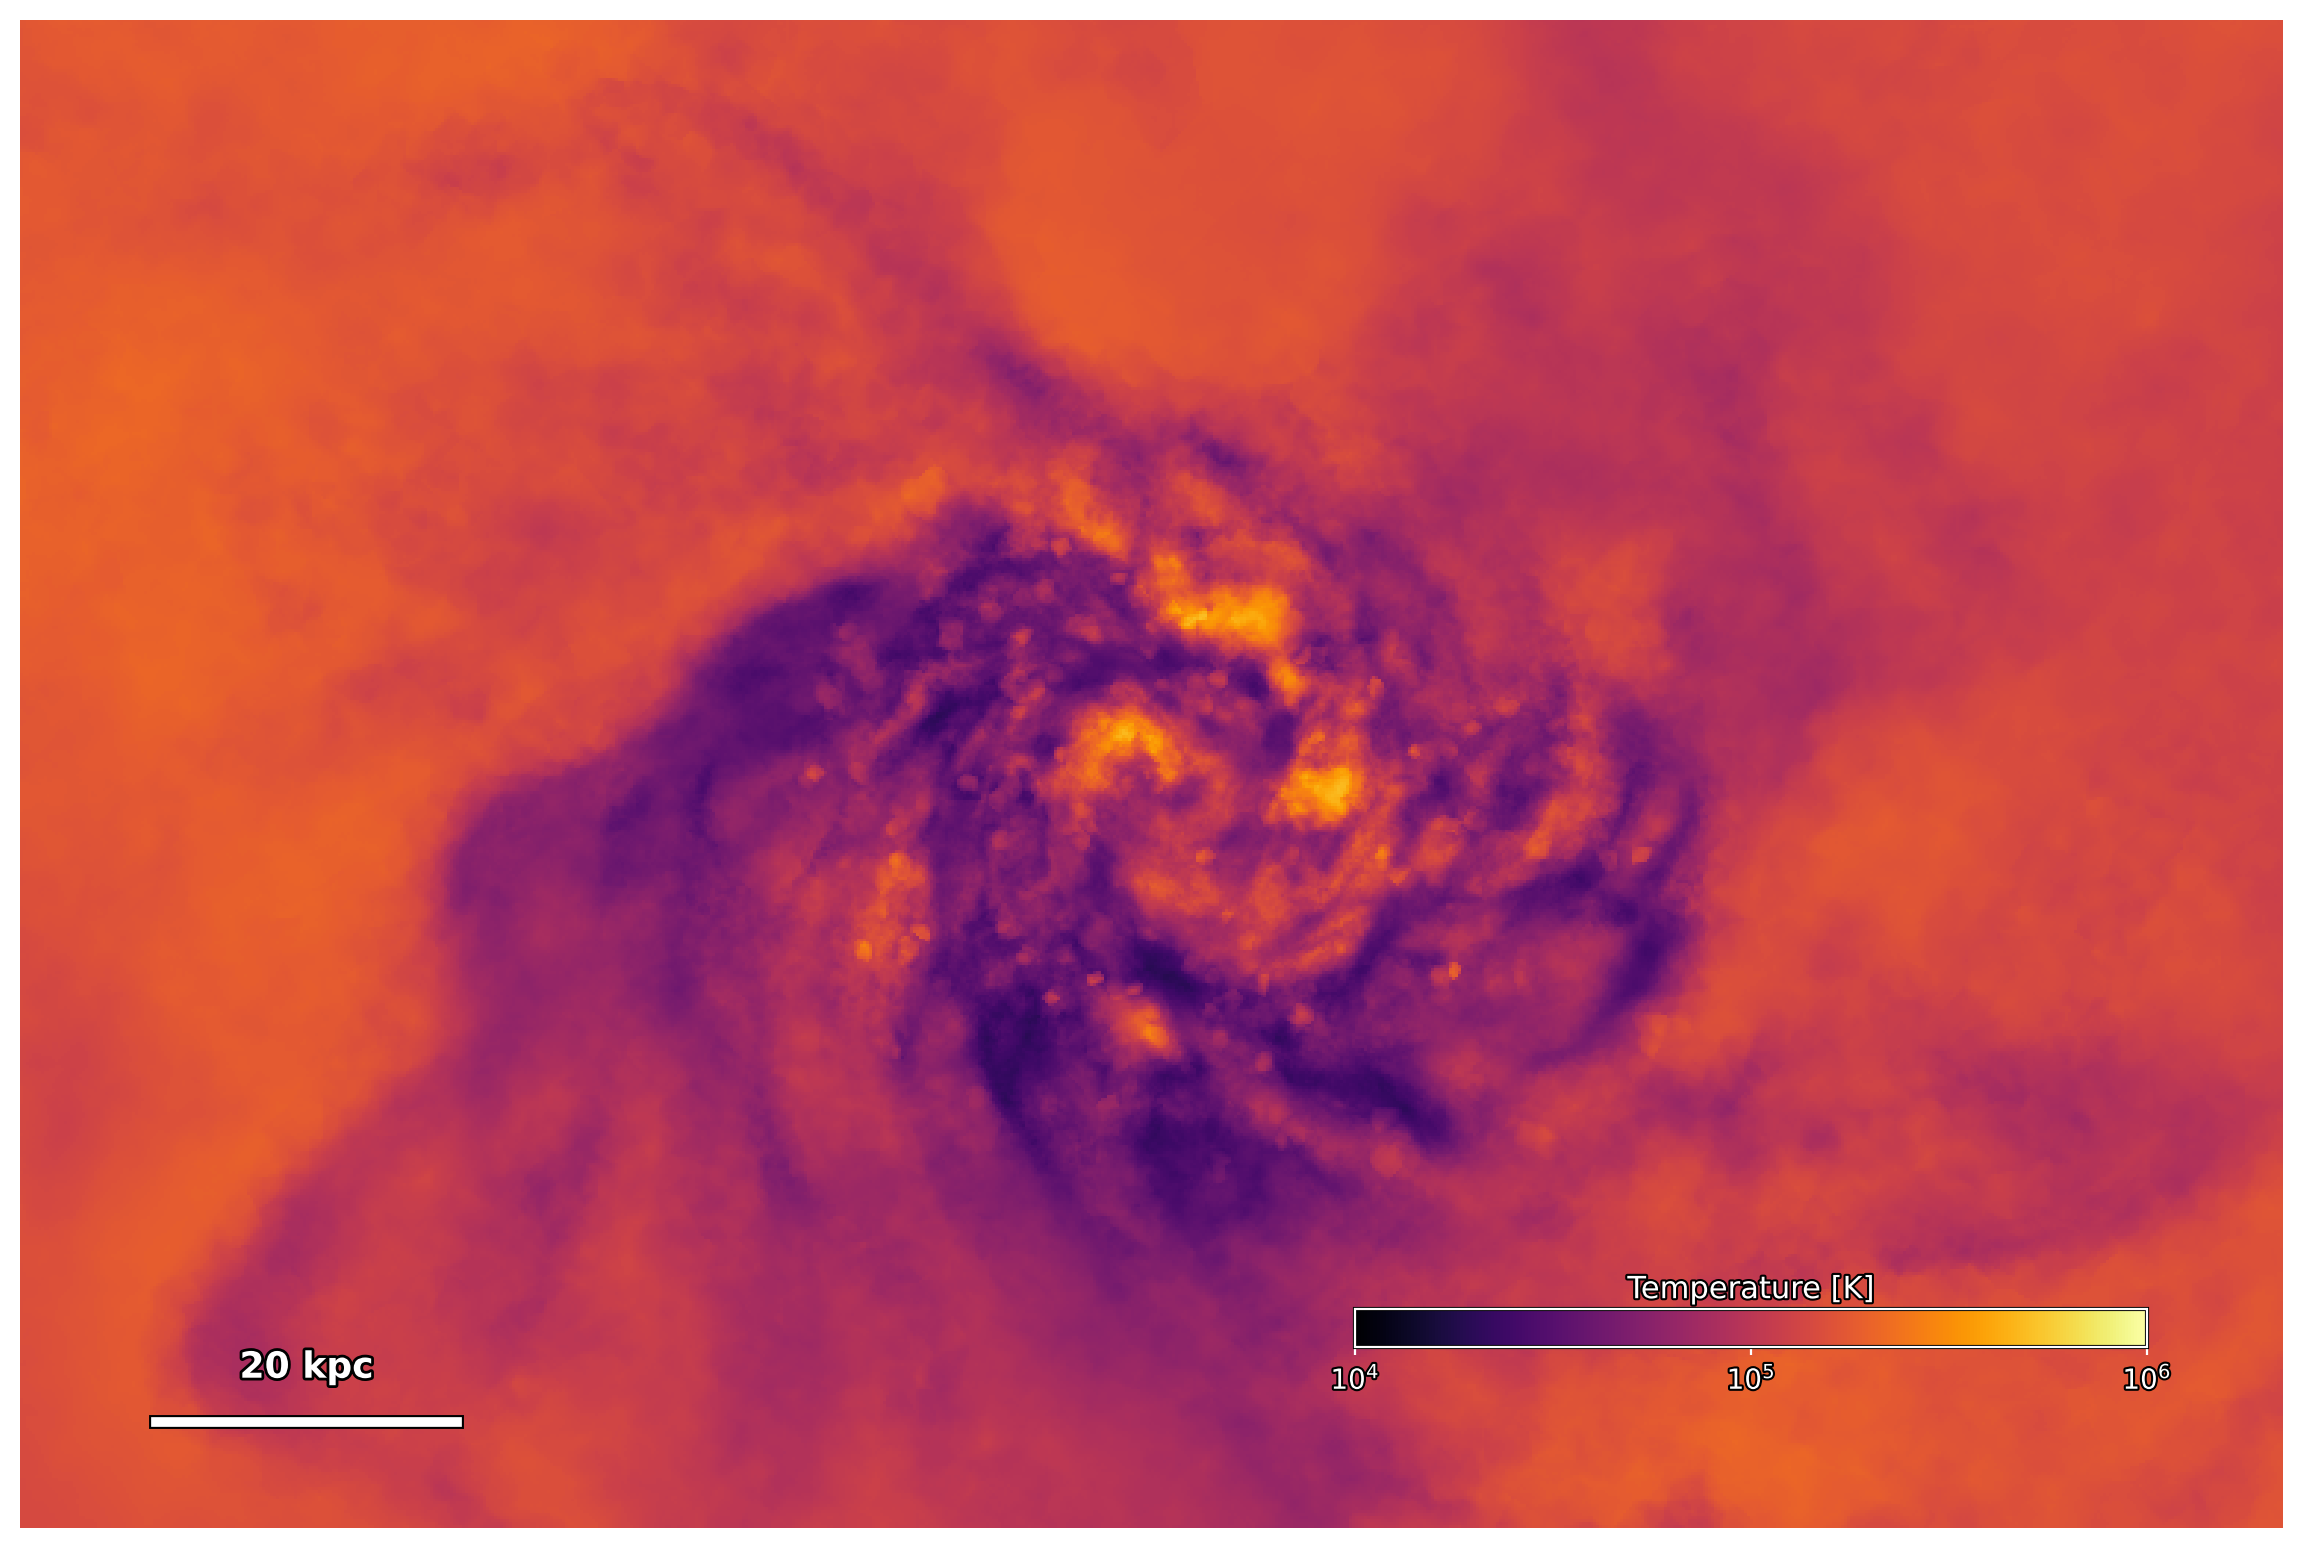
The colors show density-weighted temperature in kelvin on a logarithmic scale.
The scalebar marks 20 physical kiloparsecs. The array is stored at
projections/temperature inside the Zarr output.
4. Things to try
Increase the resolutionRender a finer map of the same galaxy.
In projection.yaml, change npixels: [768, 512] to npixels: [1536, 1024].
Run the simulation and plotting command again. This traces four times as many
rays over the same field of view, giving a finer image without changing the gas mesh.
Map H I column densitySee where neutral hydrogen is concentrated.
Copy projection.yaml to hi-column.yaml and set raytracer.outputpath to
hi-column.zr. Add HIdensity to pointcloud_voronoi.gadget.fields, then
change these settings under raytracer.operators.projections:
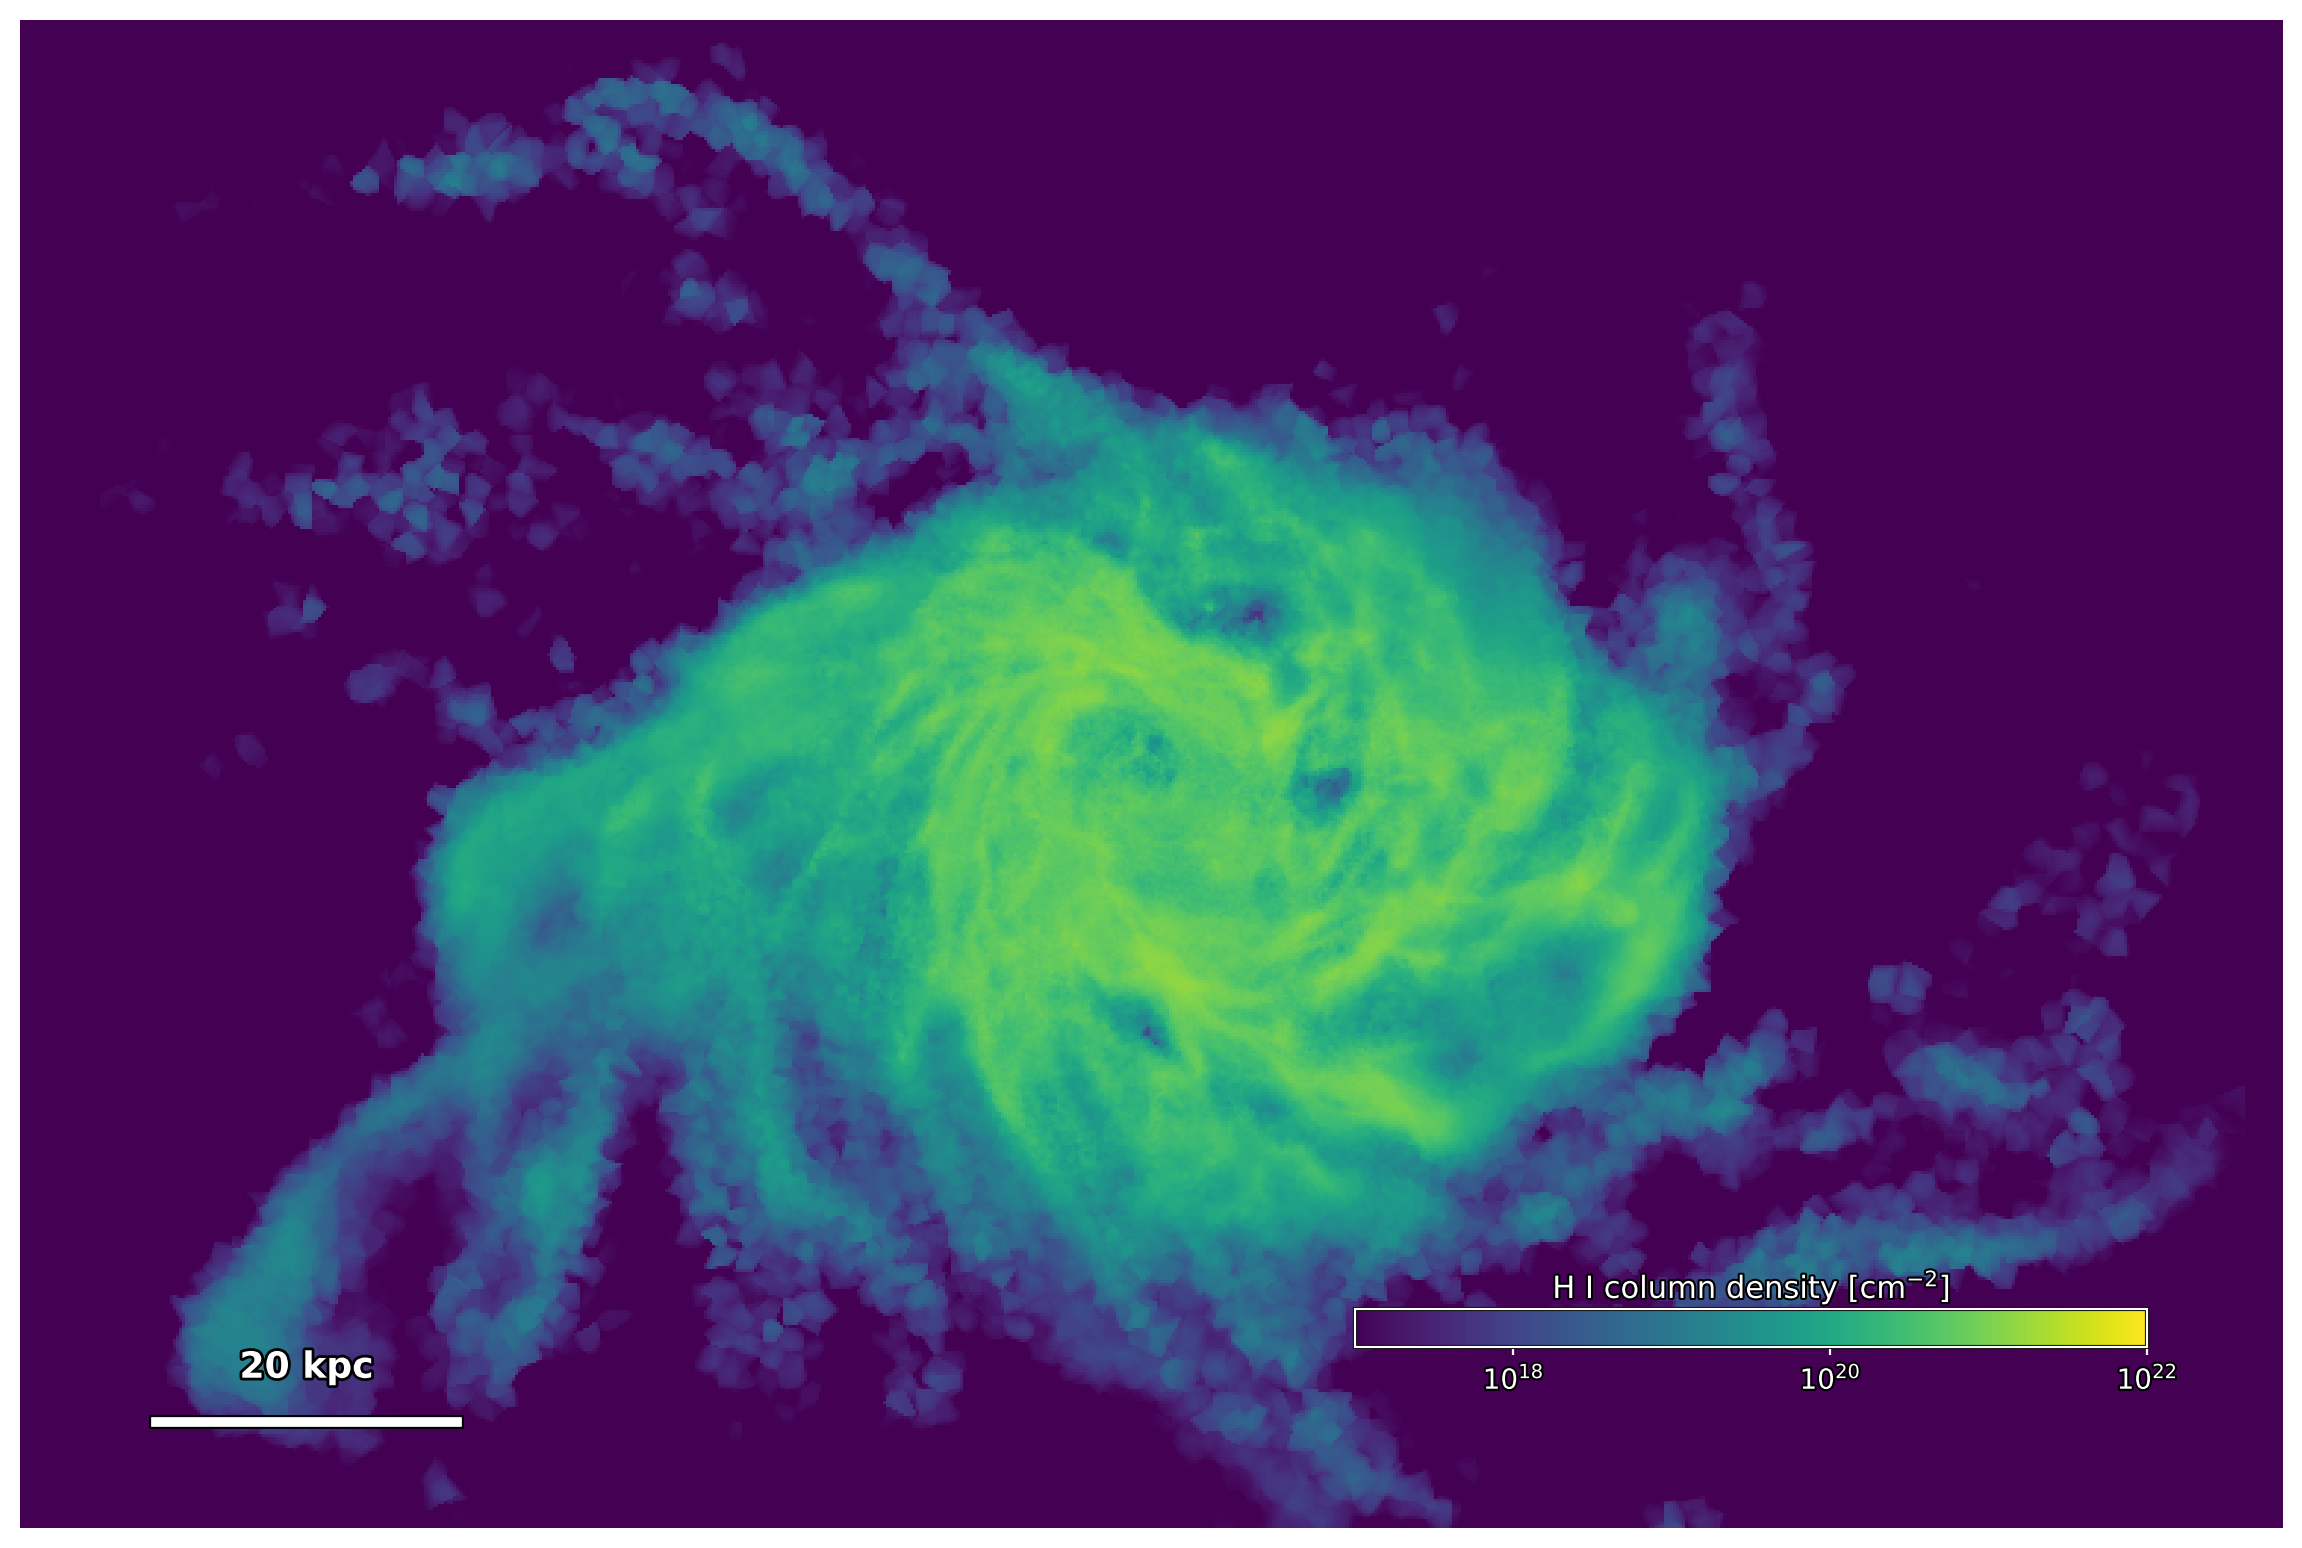
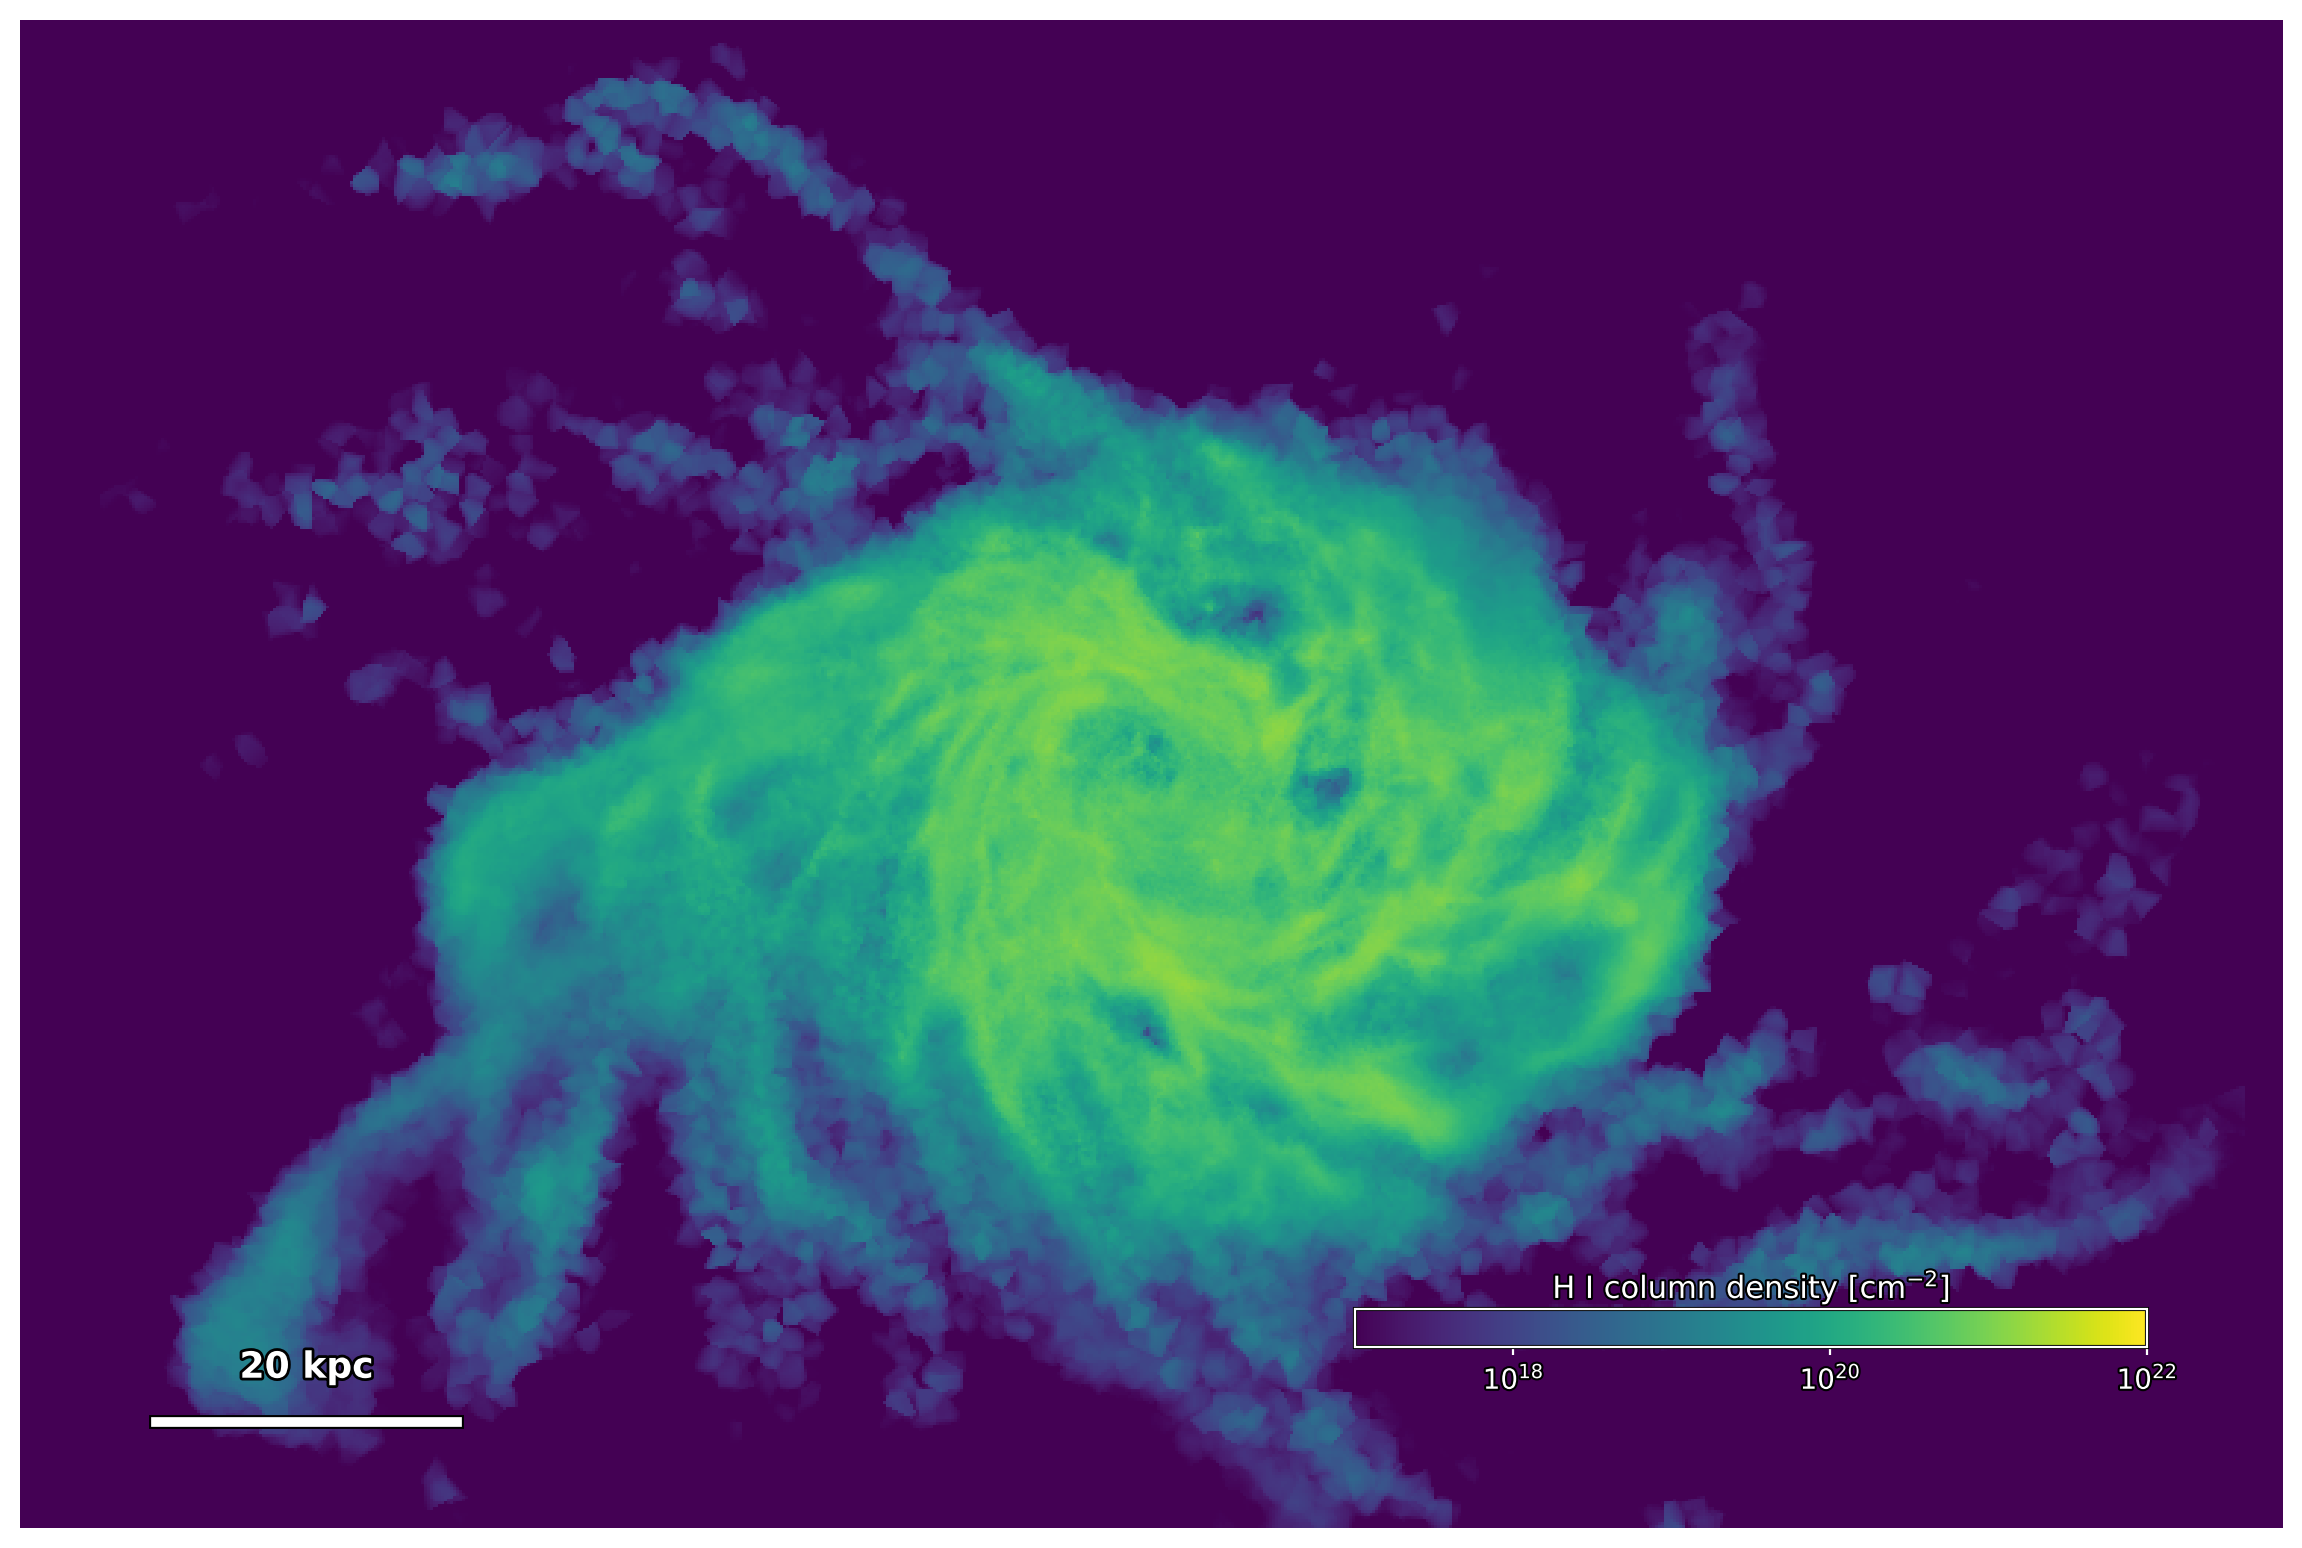
This gives \(N_{\mathrm{HI}} = \int n_{\mathrm{HI}}\,dl\) in \(\mathrm{cm^{-2}}\), using the cutout's neutral-hydrogen abundances.
Run THOR with hi-column.yaml, then download
plot_hi_column.py and run:
The output image hi-column.png shows the neutral gas column for comparison
with the temperature map.
Continue in the Cookbook
Turn a single projection into a movie by moving the camera around or through the galaxy.
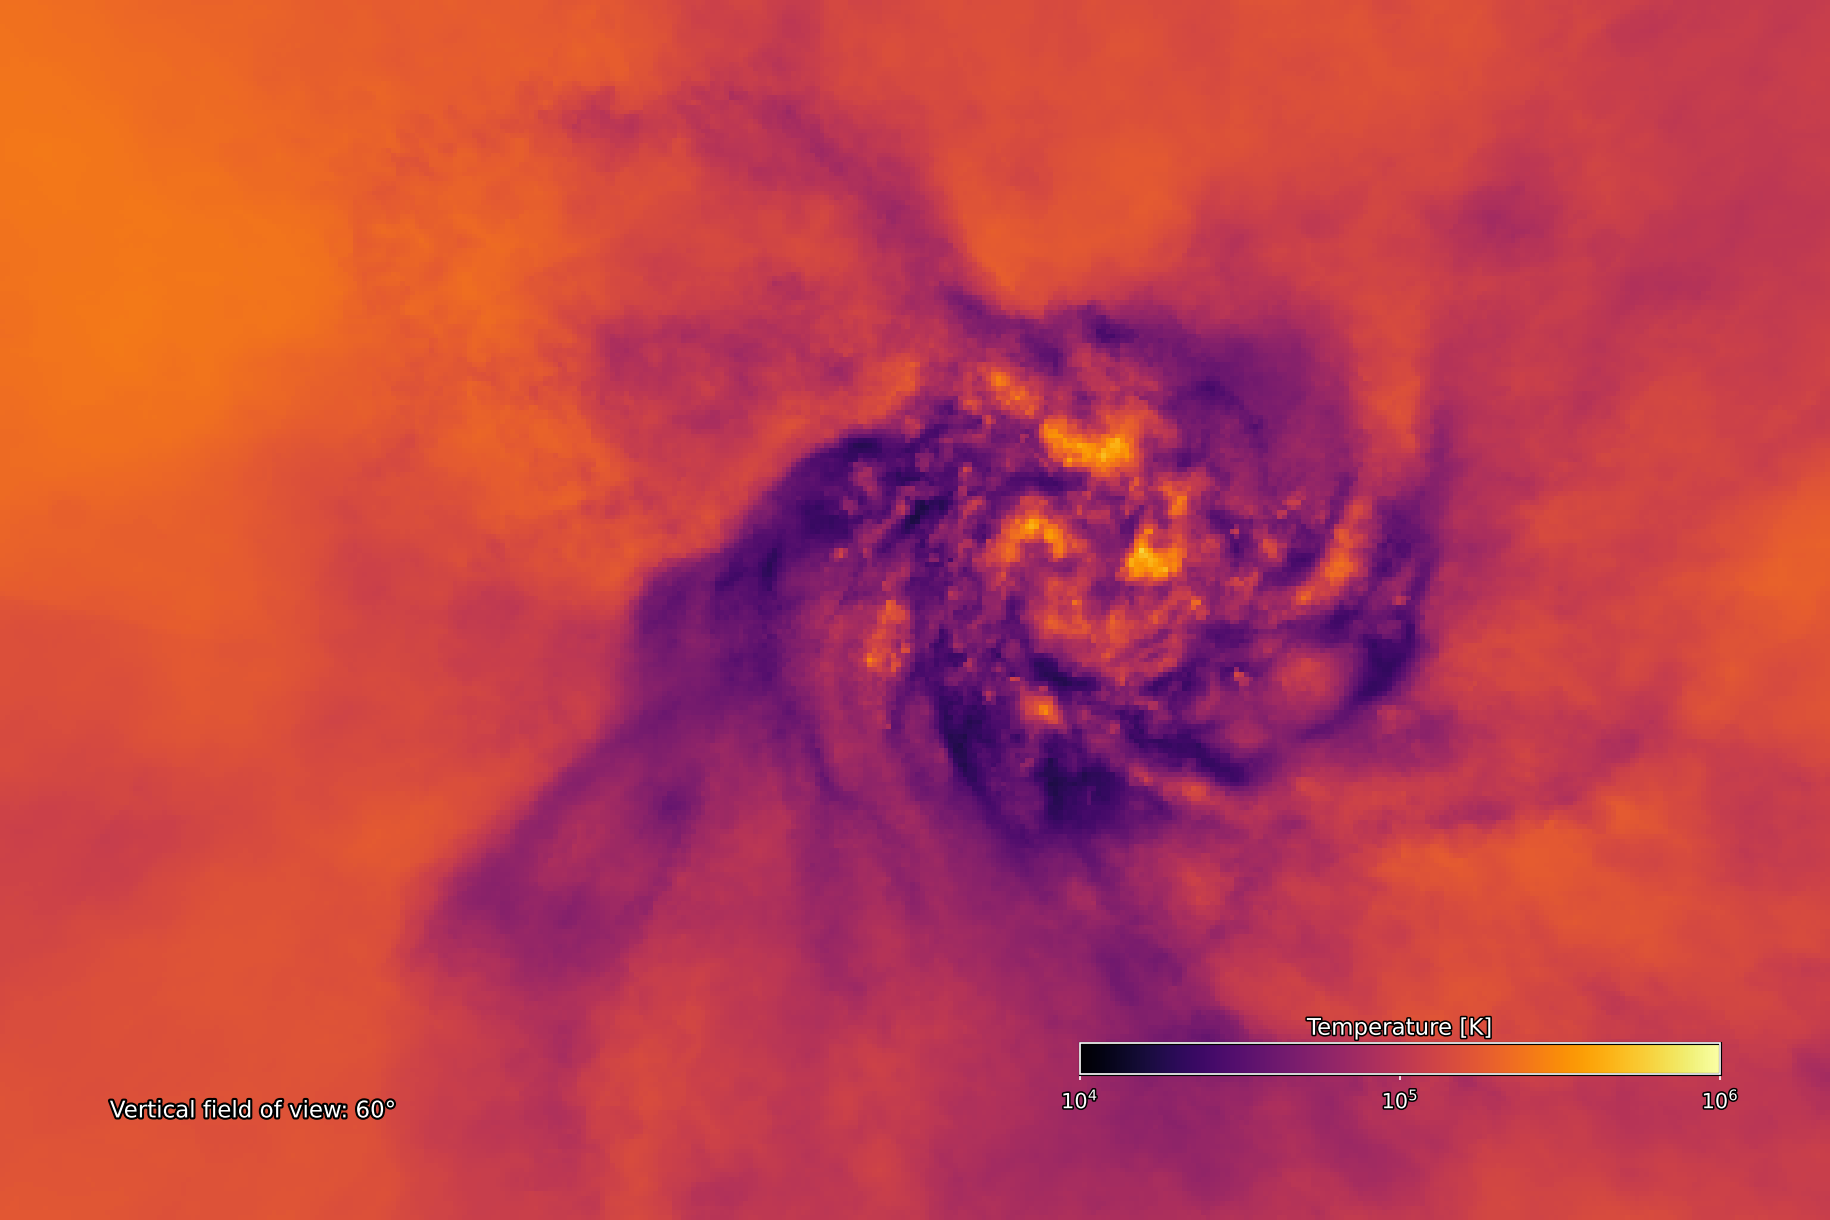
See the projection settings for camera and field options. For particle-based 360 images, see native equirectangular SPH.